Key Takeaways
Customer lifecycle mapping connects each stage to its goal, key metric, failure point, and owner so you can see where revenue actually leaks across acquisition, purchase, retention, and churn.
- Acquisition quality: High traffic volume means little if those buyers never return or churn quickly after first purchase.
- Post-purchase gaps: Weak onboarding, unclear delivery messaging, or missing follow-up often damage second-order rate more than checkout friction ever did.
- Handoff leaks: Revenue loss usually sits between teams where ownership gets vague, not inside one clean dashboard.
- Prioritise by impact: Fix leaks that affect revenue quality, repeat behaviour, or margin across large customer groups before chasing small conversion lifts.
I have sat in marketing post-mortems where paid media, CRO, and CRM each showed green. Acquisition looked fine. Checkout improved. Flows were live. And yet second-order rate was soft, LTV was drifting, and nobody could point to the leak. That is not a reporting problem. That is a lifecycle problem – and the answer is a properly built map, not another dashboard.
The short answer: Revenue leaks across the eCommerce customer lifecycle when handoffs between acquisition, first purchase, post-purchase, and retention are owned by different teams with different metrics. The fix is a stage-by-stage lifecycle map that connects each phase to one goal, one key metric, one failure point, and one owner – so you can see where value is draining before you start fixing the wrong thing.
This article is for growth leads, eCommerce managers, CRM owners, and founders who want to work out why the overall numbers look busy while repeat revenue and customer quality keep disappointing.
What customer lifecycle mapping for eCommerce actually shows
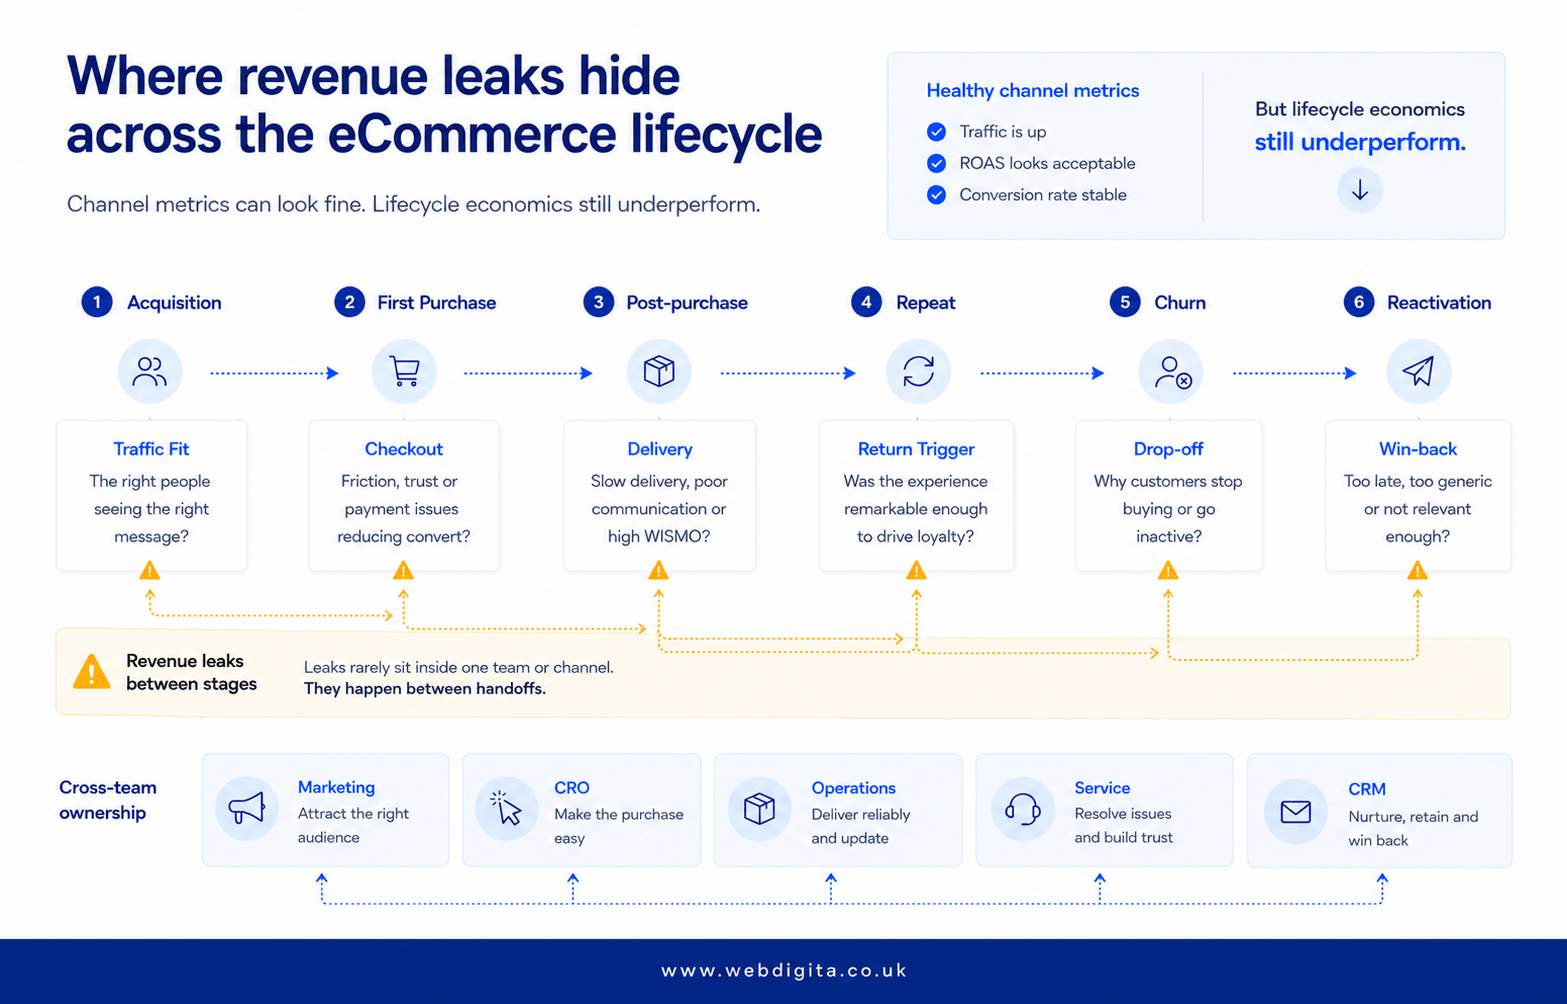
Customer lifecycle mapping for eCommerce is not a prettier funnel diagram or a CRM flow audit. It is a structured view of where revenue gets lost – across acquisition, first purchase, post-purchase, repeat purchase, churn, and reactivation – with one owner and one commercial consequence attached to each stage.
The goal is to make the full picture legible in a single working session. Most teams have data. They do not have a joined-up view of what that data means across the whole journey. That gap is where LTV quietly erodes while everyone reports upward with clean numbers.
Do not confuse healthy channel metrics with healthy lifecycle economics. You can improve checkout conversion, keep email automation running, and still damage retention if the buyers coming in are poor fit or the post-purchase experience gives them no reason to return.
Good channel performance can hide bad lifecycle economics. That is why isolated dashboards so often tell the wrong story.
Map the journey by stage before you chase fixes
Jumping straight into A/B tests, heatmaps, or new flows means you will usually optimise the wrong thing. Build the map first. Decide what deserves time and budget after.
Use a simple lifecycle leak map: for each stage, write down the goal, the key metric, the likely leak point, and the owner. Keep it tight enough that three people from different teams can agree on it in under an hour.
| Stage | Goal | Key metric | Likely leak point | Owner |
|---|---|---|---|---|
| Acquisition | Bring in fit traffic | Qualified conversion rate | Low-intent or poor-fit visitors | Marketing |
| First purchase | Convert intent | Checkout completion rate | Trust gaps or checkout friction | CRO or eCommerce |
| Post-purchase | Protect confidence | Second-order rate | Weak follow-up or service friction | CRM or operations |
| Repeat | Build retention | Repeat purchase rate | Missing triggers to return | CRM or growth |
| Churn | Reduce inactivity | Customer drop-off by cohort | Value fades after first order | Growth and service |
| Reactivation | Recover lapsed buyers | Win-back rate | Late or irrelevant re-engagement | CRM |
- Define the stage goal before picking metrics.
- Note the leak, likely cause, owner, and likely revenue effect.
- Only then decide what needs testing, fixing, or rebuilding.
If the map reveals platform constraints, broken handoffs, or unclear ownership, surface those early. That is exactly where eCommerce strategy consulting pays for itself – stopping guesswork before it turns into expensive rework.

Not sure where your lifecycle is leaking revenue
We can map your customer journey, score the leak points by commercial impact, and show you which gaps are costing you repeat revenue. Most teams find the biggest leaks sit between teams, not inside one channel.
Quick diagnostic call, no obligation, usually spots three fixable gaps
Which metrics belong to each stage – and what they actually tell you
The wrong metric creates fake confidence. Here is the distinction that matters: symptom metrics tell you something is wrong. Root-cause signals tell you why.
Acquisition quality: watch traffic fit, assisted conversion quality, bounce patterns on key landing pages, and early AOV. Volume alone is a weak signal if those customers buy once and disappear. High traffic with soft repeat rates is almost always a fit problem, not a creative problem.
First-order friction: cart abandonment, checkout drop-off, payment failure rate, and mismatch between ad promise and landing page reality. High abandonment is the symptom. Hidden shipping costs, weak trust signals, or payment issues are the likely causes. Do not run CRO tests on a page with a structural trust problem – fix the trust problem first.
Post-purchase and repeat: refund patterns, delivery complaints, low email automation engagement, time to second order, repeat purchase rate, and inactivity by cohort. A weak second-order rate tells you something is wrong, but not where. The cause may be poor onboarding, missing replenishment timing, unclear delivery expectations, or no compelling reason to return.
Sometimes the metric looks like a CRM problem when it is actually a product experience or UX problem. Clunky account flows, slow mobile paths, and weak post-purchase journeys need eCommerce development in London – not another email sequence layered on top of a broken experience.
Where revenue leaks usually hide in eCommerce
Most leaks are not hidden. They are spread across teams, so nobody owns the full picture. The expensive ones almost always sit at handoff points – where one team’s job ends and another’s begins without a clean transfer.
The first pattern: weak-fit acquisition. Traffic lands, first orders happen, numbers look acceptable – but those buyers were never likely to become retained customers. The team then blames CRM for a retention problem that was actually created at the paid traffic brief stage.
The second pattern: post-purchase confidence collapse. The first sale lands, then the experience goes quiet. Delivery messaging is vague, onboarding is non-existent, returns feel difficult, and the follow-up sequence gives no obvious reason to come back. The customer churns before anyone notices.
The scenario I see most often: paid media reports CAC is controlled, CRO reports checkout improved, CRM reports flows are live. Yet second-order rate stays soft and LTV drifts. The leak sits between those three teams, not inside any one of their dashboards.
That pattern is also why eCommerce growth stalls even when traffic keeps growing – the problem is system-wide, not campaign-specific.
The post-purchase leak most teams miss entirely
My experience across lifecycle mapping engagements points to the same finding, consistently: the bigger revenue leak is almost always after first conversion, not before it.
That surprises teams. Pre-purchase reporting is usually clean – there are dashboards for ads, for checkout, for landing pages. Post-purchase friction is spread across CRM, operations, service, and product experience with no single owner and no single number that captures the damage.
The result is that pre-purchase gets the budget and the testing resource. Post-purchase gets the quarterly CRM audit. The lifecycle mapping process forces that imbalance into the open – and that is where the real commercial upside sits for most brands at this scale.
If churn is rising, do not pour more spend into acquisition until you understand what is driving the retention problem underneath it. Fixing the post-purchase leak is almost always cheaper than acquiring your way out of it.
How to tell which leak matters first
Not every leak deserves the same urgency. Prioritise by commercial weight, not by which team is making the most noise or has the clearest reporting.
Start with leaks that affect revenue quality, repeat behaviour, or margin across a large customer group. A post-purchase friction point hurting second-order rate across thousands of customers can matter more commercially than a small uplift in first-order conversion – even if the latter is easier to test and report.
- How much revenue, retention, or margin does this likely affect across the cohort?
- Can you validate the cause quickly, or does it need discovery first?
- Is there one clear owner who can act without cross-team sign-off?
- Does fixing it unlock compounding gains later in the journey?
If ownership is genuinely split across three teams, treat that as a structural warning – not a quick win. Assign a lead before assigning a fix.
Turn the map into a growth roadmap
A good map should end arguments and start action. Turn the findings into a now, next, and later roadmap with one owner per leak and one success metric per item.
Put work into now when the impact is clear and the dependency is low. Put structural fixes into next when they need design, development, or cross-team coordination. Push lower-value work into later so it does not block delivery on what actually matters.
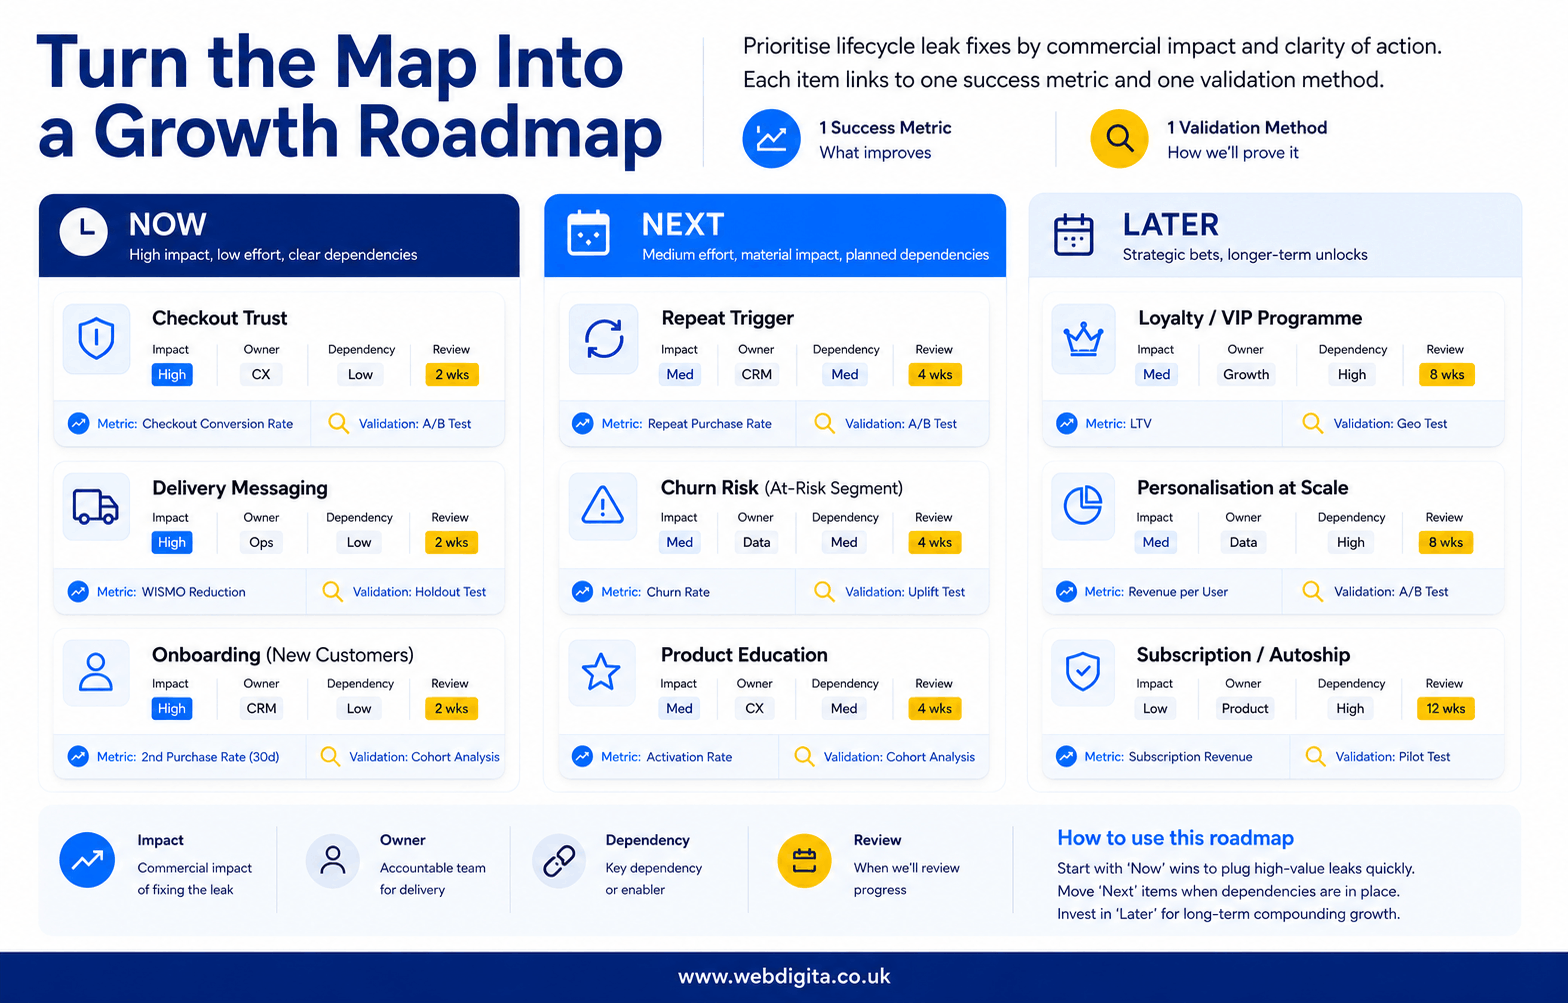
For each item: one success metric, one validation method, one review date. That keeps the roadmap honest and stops teams from calling something fixed just because it shipped.
Heatmaps, session recordings, and A/B testing help you validate what is happening at a specific point. They do not tell you where the business is leaking value across the full lifecycle. Use them after the map is built – not instead of building it.
If you are moving from diagnosis into action, make sure the roadmap covers post-launch ownership as well as the fix itself. eCommerce maintenance matters here – support gaps can quietly reopen the same leaks you just paid to close.
If growth feels thinner than the reporting suggests: map the lifecycle properly, score the leaks by impact and ownership, and build the roadmap from there. The answer is almost never in the channel doing worst. It is in the handoff nobody owns.
Questions teams ask before mapping their customer lifecycle
Practical answers about where to start, what to measure, and how to prioritise lifecycle leaks in eCommerce.
1. What is customer lifecycle mapping in eCommerce?
Customer lifecycle mapping shows where revenue gets lost across acquisition, first purchase, post-purchase, repeat purchase, churn, and reactivation. It connects each stage to a goal, key metric, likely failure point, owner, and commercial effect so you can prioritise fixes by impact rather than guesswork. The map helps you see whether leaks sit inside one channel or across handoffs between teams.
2. How do I know which lifecycle stage is leaking the most revenue?
Start by mapping each stage with its goal, key metric, and likely leak point. Then score leaks by how much revenue, retention, or margin they affect across a large customer group. Post-purchase issues hurting second-order rate across thousands of buyers often matter more than small first-order conversion lifts. Prioritise leaks where ownership is clear and the commercial weight is high.
3. Why does repeat purchase rate stay weak even when checkout conversion improves?
Checkout conversion measures first-order intent, not customer quality or post-purchase confidence. Weak repeat rate usually points to poor-fit acquisition, unclear delivery expectations, weak onboarding, missing follow-up, or no real reason to return. The leak often sits after purchase where ownership gets split across CRM, operations, and service rather than inside one clean funnel.
4. What metrics should I track for post-purchase performance?
Watch refund patterns, delivery complaints, low email engagement, time to second order, repeat purchase rate, and inactivity by cohort. A weak second-order rate tells you something is wrong but not why. The cause may be poor onboarding, weak replenishment timing, unclear delivery expectations, or missing triggers to return. Track root-cause signals, not just symptom metrics.
5. How do I turn a lifecycle map into a working roadmap?
Put work into now when impact is clear and dependency is low. Put structural fixes into next when they need design, development, or cross-team coordination. Push lower-value work into later so it does not clog delivery. For each item, set one success metric, one validation method, and one review point so you know whether the fix actually worked.
6. Where do most eCommerce revenue leaks actually hide?
Most leaks sit at handoff points between teams where ownership gets vague. Common patterns include weak-fit acquisition that damages retention later, post-purchase confidence drops from unclear delivery or weak onboarding, and missing triggers to return after first purchase. The leak often spans marketing, CRO, CRM, operations, and service rather than sitting inside one dashboard.
7. Should I fix acquisition quality or post-purchase friction first?
Prioritise by commercial weight, not by which team is making the most noise. If post-purchase issues are hurting second-order rate across thousands of customers, that can matter more than a small uplift in first-order conversion. Fix leaks that affect revenue quality, repeat behaviour, or margin across large customer groups before chasing isolated channel improvements.
8. How do I validate whether a lifecycle fix actually worked?
Set one success metric and one validation method before you ship the fix. Watch the metric across a full purchase cycle, not just the first week. Use session recordings, refund patterns, cohort behaviour, and repeat purchase data to validate whether the change improved the real leak or just moved the symptom. Review the result at a set point and decide whether to scale, adjust, or stop.
Conclusion
If growth feels thinner than your reporting suggests, the problem usually sits across the lifecycle rather than inside one channel or one flow.
- Map each stage by goal, metric, leak point, and owner before you start fixing things.
- Prioritise leaks by commercial weight, not by which team is making the most noise.
- Turn the map into a now, next, and later roadmap with one clear owner per leak.
- Set one success metric and one validation method for each fix so you know whether it actually worked.
Good channel performance can hide bad lifecycle economics for months. Build the map, score the leaks properly, and fix the ones that matter most to retention and margin first.
Ready to turn lifecycle gaps into a working growth roadmap
We help eCommerce teams map revenue leaks, prioritise fixes by impact and ownership, and build roadmaps that connect acquisition, retention, and repeat behaviour into one coherent plan.
See how we support eCommerce growthOr if you prefer